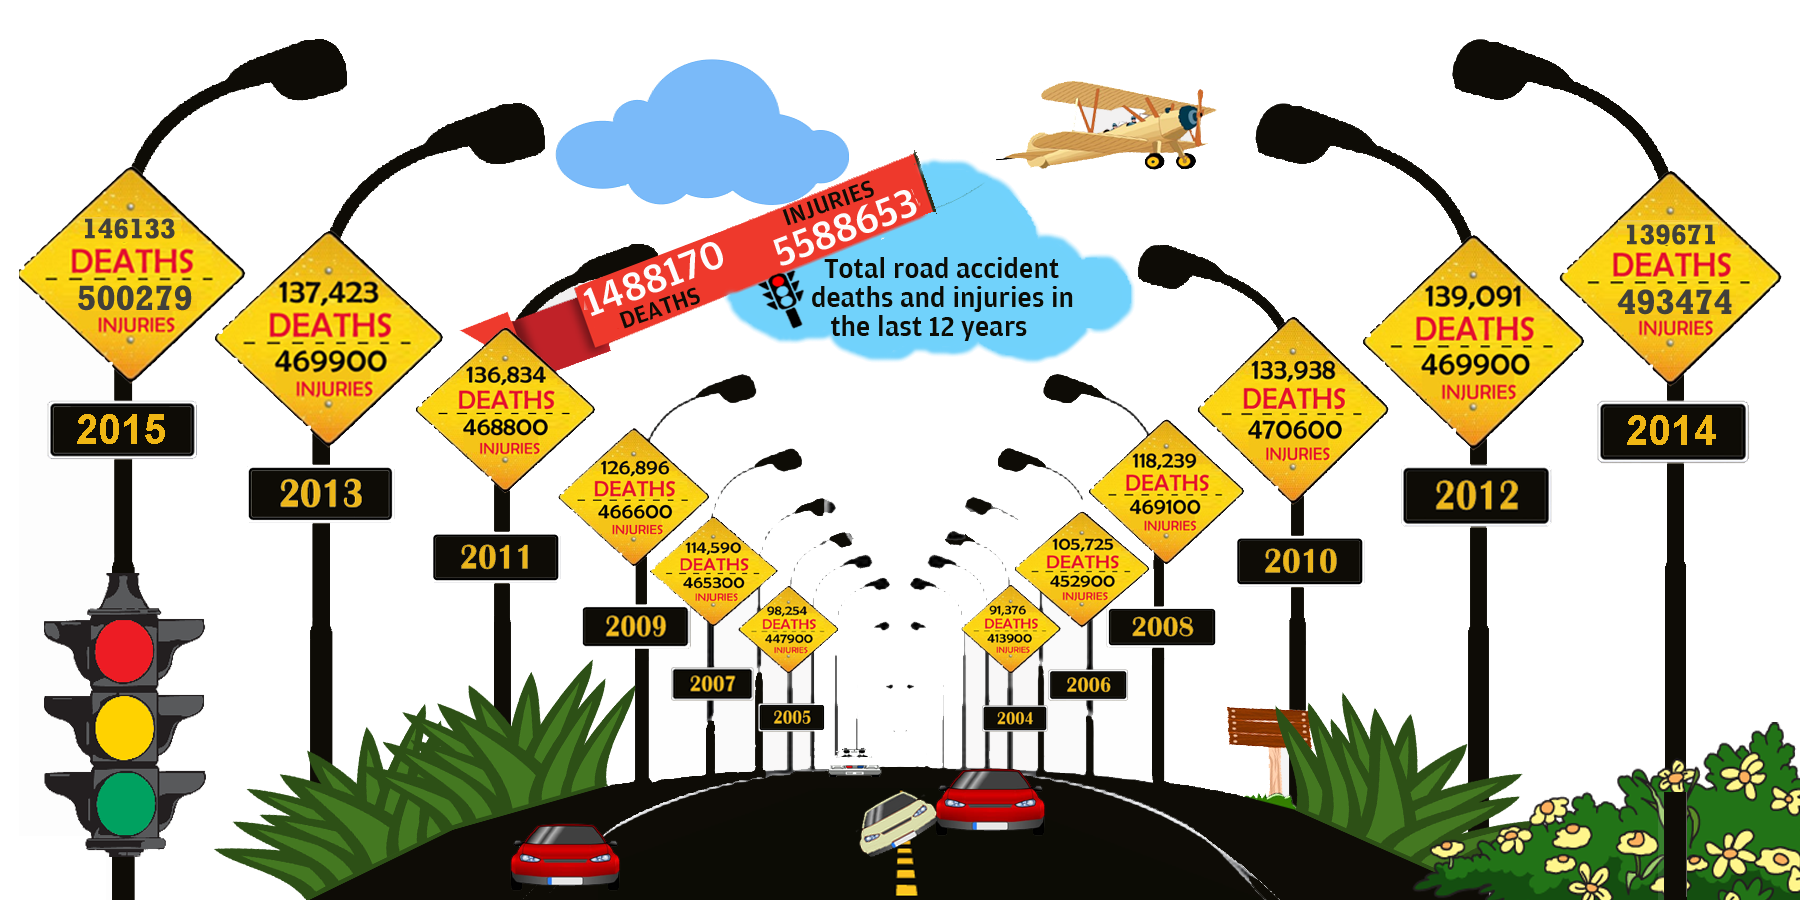
Every day, 400 or one life snuffed out every 3.6 minutes in road accidents in India
India is committed to reduce the number of road accidents and fatalities by 50 per cent by 2020. However, road safety levels have taken a serious hit with the country witnessing one of the highest growth rates of vehicles in the world and rapid urbanisation over the years. It is even more disconcerting to know the road accidental deaths of young people in the productive age group, causing substantial loss of productivity to the nation.
☛ Data source: Road accidents in India, 2015, Ministry of Road Transport and Highways, India
Did you know rural areas are more prone to road accidents?
☛ Data source: Road accidents in India, 2015, Ministry of Road Transport and Highways, India
Rural areas are more prone to road accidents, accounting for 53.8 per cent of total road accidents during 2015. The percentage of road accident fatalities (61.0 per cent) and injuries (59.1 per cent) were also more in rural areas as compared to the urban areas in the country.
☛ Data source: Road accidents in India, 2015, Ministry of Road Transport and Highways, India
According to the report titled "Road Accidents in India 2015", compiled by the Transport Research Wing, the total number of road accidents increased by 2.5 per cent from 489,400 in 2014 to 501,423 in 2015. The total number of persons killed in road accidents increased by 4.6 per cent from 139,671 in 2014 to 146,133 in 2015. Road accident injuries have also increased by 1.4 per cent from 493,474 in 2014 to 500,279 in 2015.
✎ How to use map: Move mouse over the bubble to know more
☛ Data source: Road accidents in India, 2015, Ministry of Road Transport and Highways, India
Maharashtra reported most road accidents in 2015 after TN
Maharashtra ranked second in number of road accidents in the country in 2015, according to the report. The state reported most number of accidents (63,805) after Tamil Nadu (69,059).
✎ How to use graph: Mouse move over the states to see details
☛ Data source: Road accidents in India, 2015, Ministry of Road Transport and Highways, India
According to provisional police data provided by states, Uttar Pradesh recorded the maximum number of road deaths (17,666), followed by Tamil Nadu (15,642), Maharashtra (13,212), Karnataka (10,856) and Rajasthan (10,510).
✎ How to use map: Mouse move over the states to know more
☛ Data source: Road accidents in India, 2015, Ministry of Road Transport and Highways, India
While the number of road fatalities increased in all big states, 10 smaller ones and UTs, including Delhi and Chandigarh, reported a decline. Assam registered the sharpest decline of 115 deaths in 2015 in comparison to the previous year, while fatalities dipped by 49 in Delhi.
Road accidents based on age and gender
The total number of males and females killed in 2015 were 120,626 (82.5 per cent) and 25,507 (17.5 per cent) respectively. The age group of 25-34 years was the most vulnerable towards death by road accidents.
☛ Data source: Road accidents in India, 2015, Ministry of Road Transport and Highways, India
Persons killed in Road Accidents in terms of Road User Categories
Motorised vehicles accounted for 95.5 per cent of the total road accidents in 2015. Four-wheelers%4both light and heavy%4caused more than 50 per cent of the total number of fatal accidents, deaths and injuries.
☛ Data source: Road accidents in India, 2015, Ministry of Road Transport and Highways, India
Causes of road accidents
Defect in road condition caused 7,314 accidents killing 2,733 and injuring 6,122 others. However, defect in motor vehicles has caused higher number of accidents (11,601) and thus, greater number of deaths (4,127) and injuries (9,818).
✎ How to use graph: Mouse move over the bubble to know more
Cross-country comparison of incidence of road related deaths and
injury accidents in 2013

☛ Data source: World Health Organisation (WHO)
Injury accidents per lakh of population in India was substantially lower at around (40)
United States of America reported the highest figure in respect of injury accidents per lakh population at (513) followed by Japan (494), Republic of Korea (429), Germany (361) and Canada (348). Niger reported the lowest figure in respect of injury accidents per lakh population at (36).
☛ Data source: 1. For India %3 Transport Research Wing, Ministry of Road Transport & Highways.
2. For Other Countries %3 World Road Statistics, 2015.
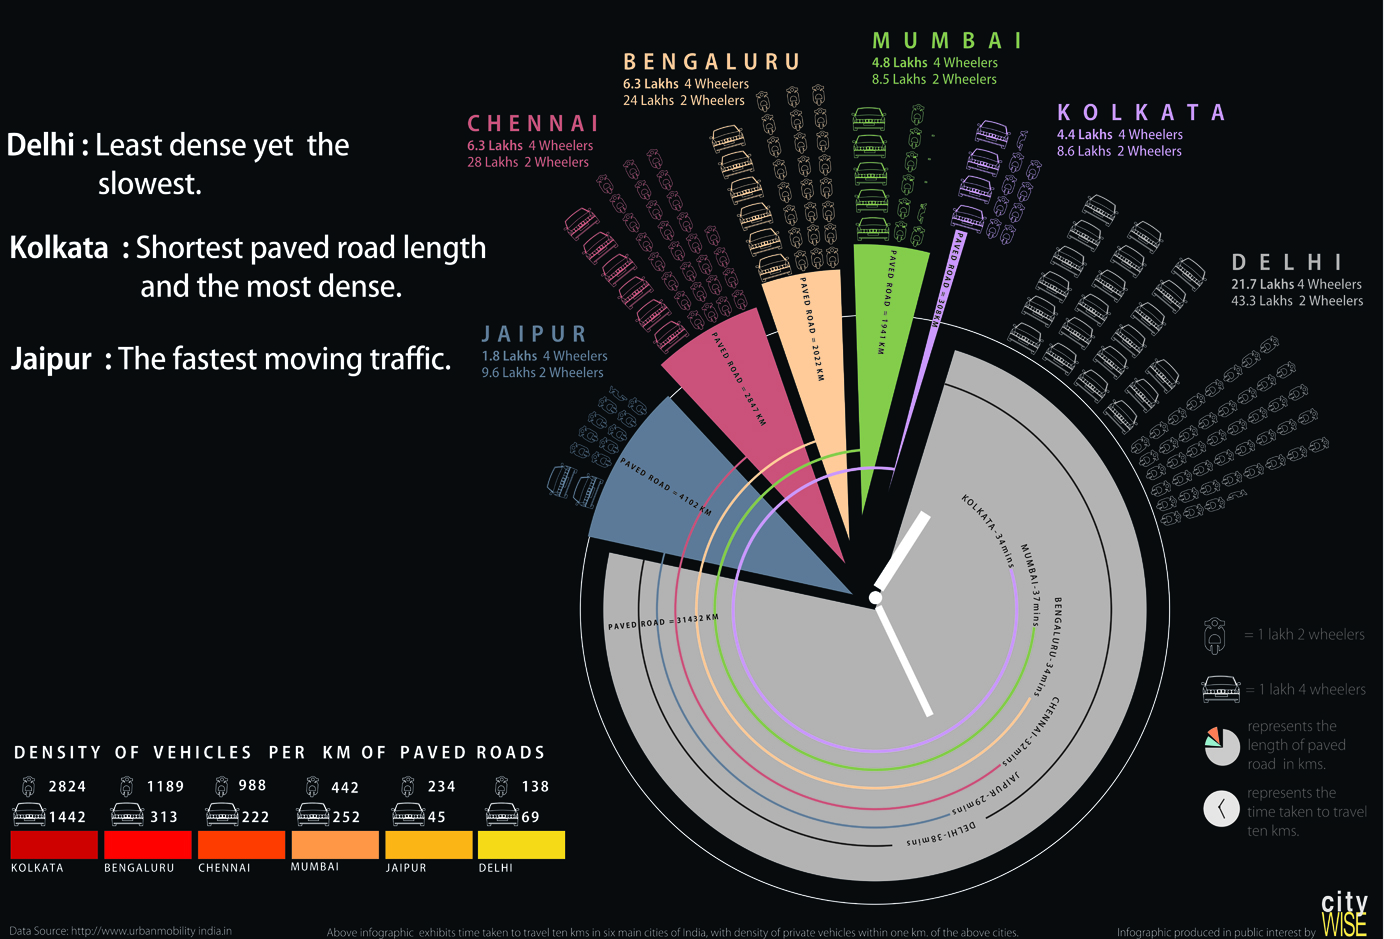
☛ Data source: Urban Mobility India : Ministry of Urban Development, Govt of India and World Resource Institute (WRI)
India has the worst road safety standards in the world, a fact repeatedly outlined in World Health Organization reports and backed up by the government's own reports. The NCRB data shows that as many as 43,540 people were killed in accidents involving two-wheelers. Dangerous or careless driving or overtaking resulted in the death of 48,093 deaths. More Indians die each and every year in road accidents than the total casualties suffered by India's armed forces in all the wars fought since independence.
¤ Data Courtesy:
1. Road accidents in India, 2015, Ministry of Road Transport and Highway
2. National Crime Records Bureau (NCRB) report, 2015
3. World Health Organisation
4. World Road Statistics, 2015
5. Urban Mobility India : Ministry of Urban Development
¤ Text and Analysis: Lalit Maurya and Subhojit Goswami
BACK TO TOP