Extreme is new normal
It is time to accept that we are beginning to see the impact of climate change in the form of increased frequency and intensity of extreme weather events, and this would get worse with rising temperature.
It is time to accept that we are beginning to see the impact of climate change in the form of increased frequency and intensity of extreme weather events, and this would get worse with rising temperature.

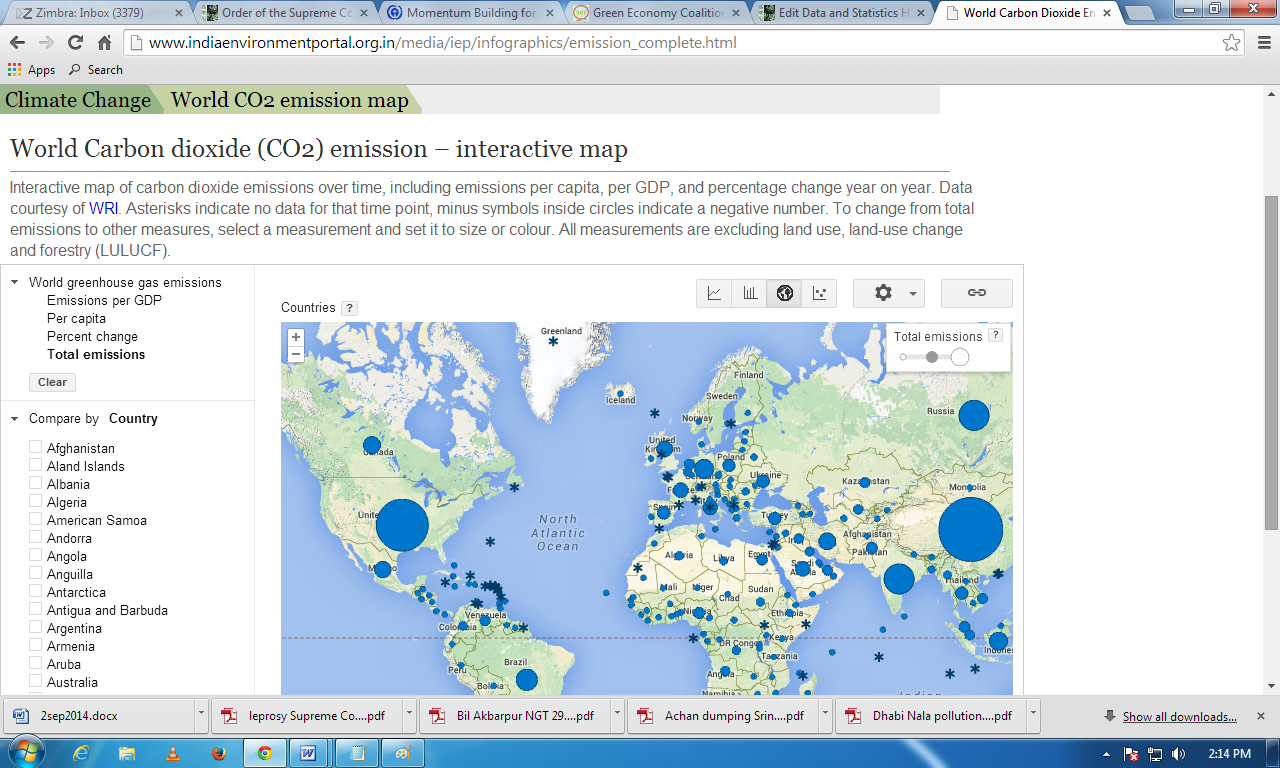
This interactive map shows how CO2 emissions have risen over the years since 1990 globally. It is based on WRI data on- carbon dioxide emissions over time, including emissions per capita, per GDP, and

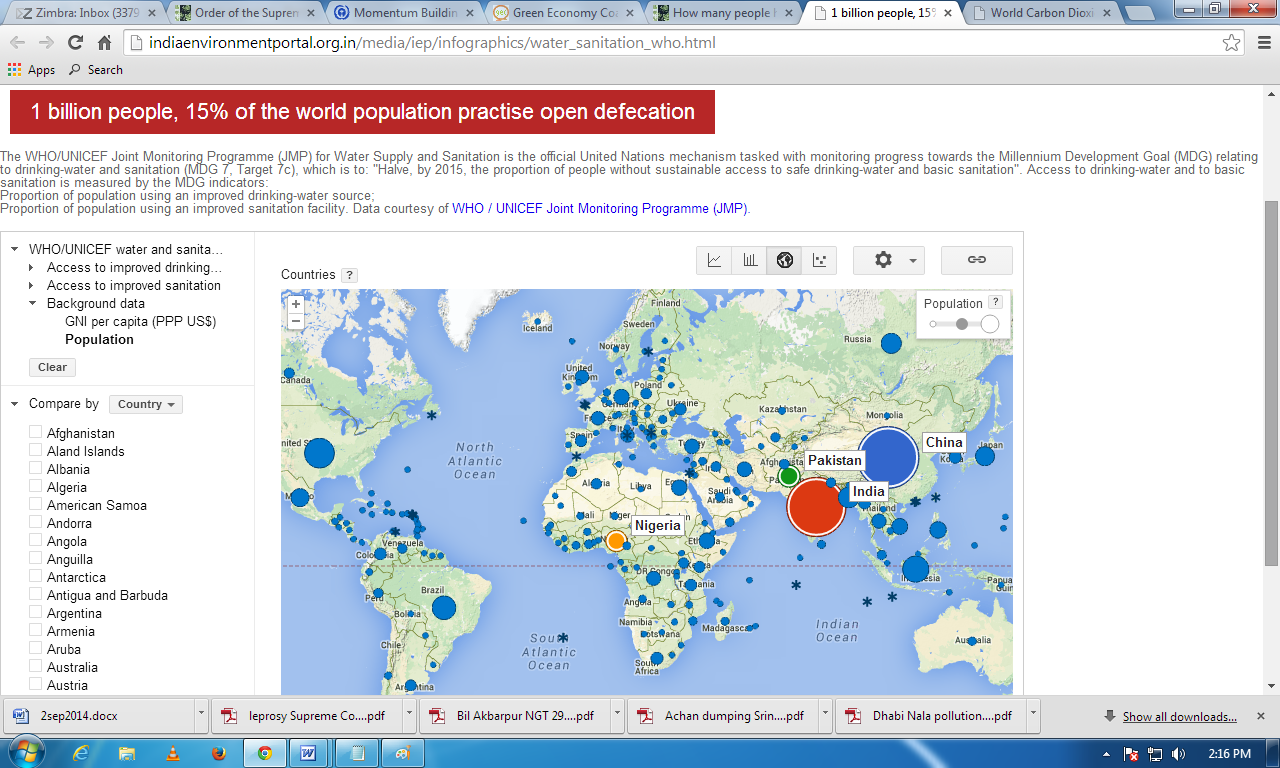
Use this interactive guide to check progress made by people in providing safe drinking water, sanitation to their people since 1990.